ApexSQL Monitor 2016 R2 Released
ApexSQL Monitor 2016 R2, a Windows and SQL Server monitoring tool, has been released.

Apex, NC, August 16, 2016 --(PR.com)-- ApexSQL, a Microsoft Gold Certified Partner and major provider of Microsoft SQL Server solutions, announced the release of ApexSQL Monitor 2016 R2.
About ApexSQL Monitor: ApexSQL Monitor is a Windows and SQL Server monitoring tool with a wide range of monitored metrics. It tracks Windows, SQL Server instance, and database metrics on multiple local and remote machines and SQL Server instances. It monitors the most important SQL Server statistics, memory, buffer, and page metrics – batch requests per second, user connections, target and total server memory, buffer cache hit ratio, batch requests, page life expectancy, page reads and writes per second, and more. ApexSQL Monitor also tracks SQL Server wait statistics including the individual queries wait statistics. Monitoring these metrics enables you to identify and troubleshoot performance problems, establish trends, and set baselines.
For more information, visit the ApexSQL Monitor product page.
ApexSQL Monitor 2016 R2 includes the following new features and improvements:
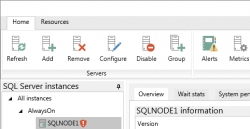
· Full support for AlwaysOn availability groups monitoring with graphical presentation of all WSFC nodes and AG replicas including the relations
· Index monitoring including the index metrics and graphical presentation
· Stricter alerting engine ensures triggering only alerts that complies with user defined alert period
· Alert management with ability to resolve individual alerts, insert comments and reporting on active and resolved alerts
· Query performance and query waits alerting
· Query performance history
· Individual query history
· SNMP notifications on alerts
· Improved functionality of custom metrics
· Performance improvements
See also: ApexSQL Monitor 2016 R2 release notes
Contact
ApexSQL Software
Milos Kostadinovic
+1 (866) 665-5500
www.apexsql.com
Milos Kostadinovic
+1 (866) 665-5500
www.apexsql.com
Categories
